Roller Screens
Roller screens are our specialty, mainly in the area of mineral (iron ore) processing. Thanks to WooDEM and custom-developed pellet contact model, we can capture results from these complex machines quantitatively.
Screen types
Screens segregate feed into 2 or 3 resulting streams:
-
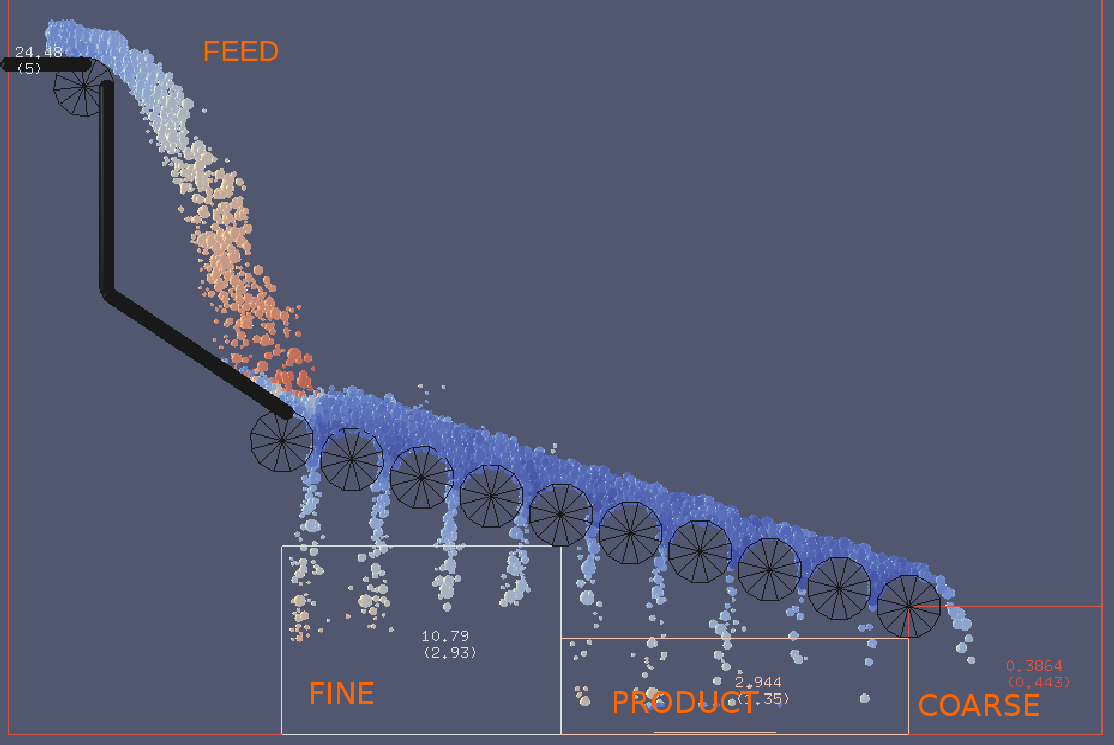
Classifier-type screens are used immediately after pelletizing (balling) discs and separate the feed into 3 streams: fine, product and coarse.
-
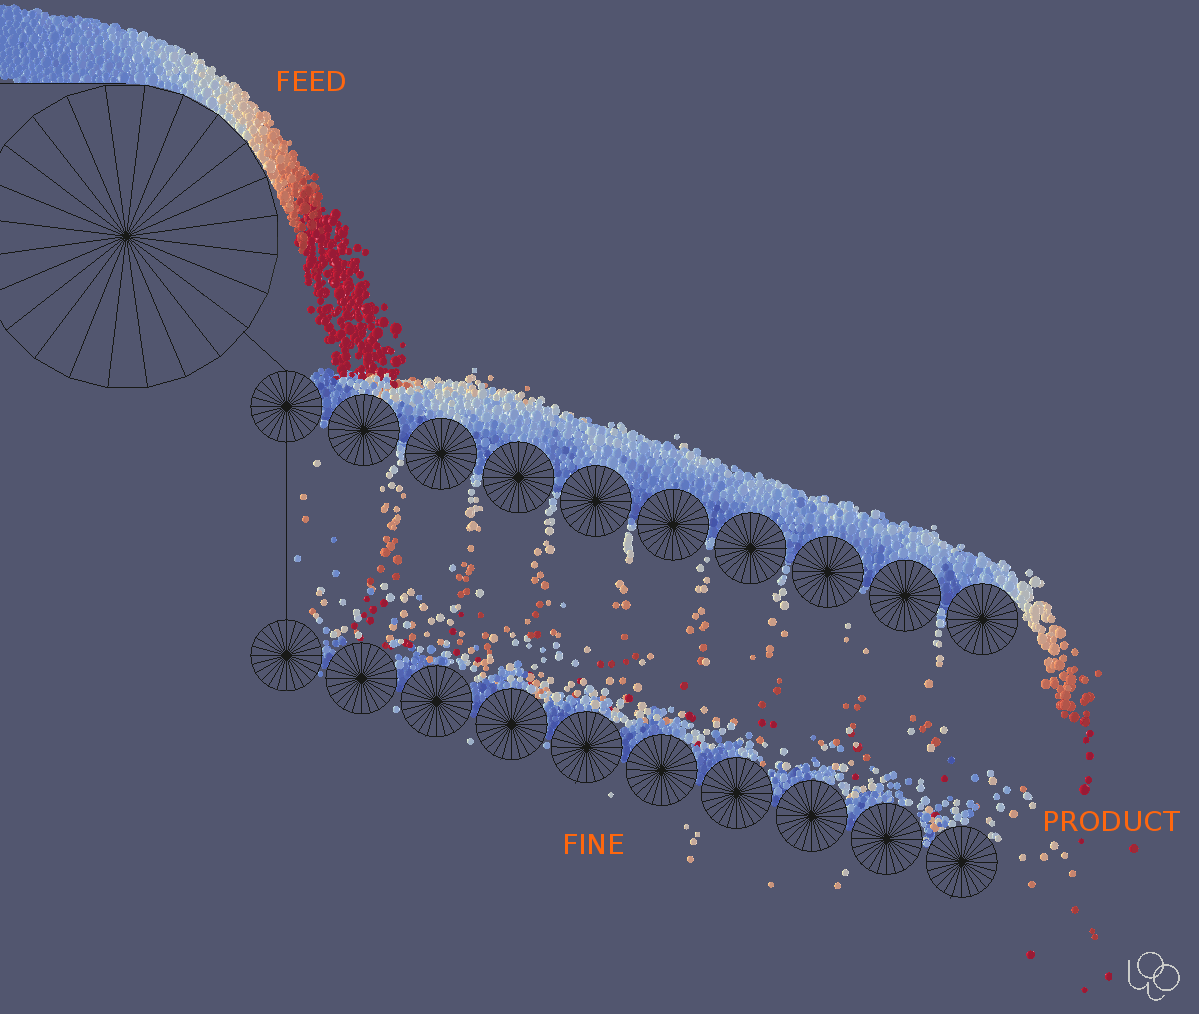
Feeder-type screens are used to separate fine pellets from product, often used before green pellets go into furnace for burning. These screens sometimes have more than one deck.
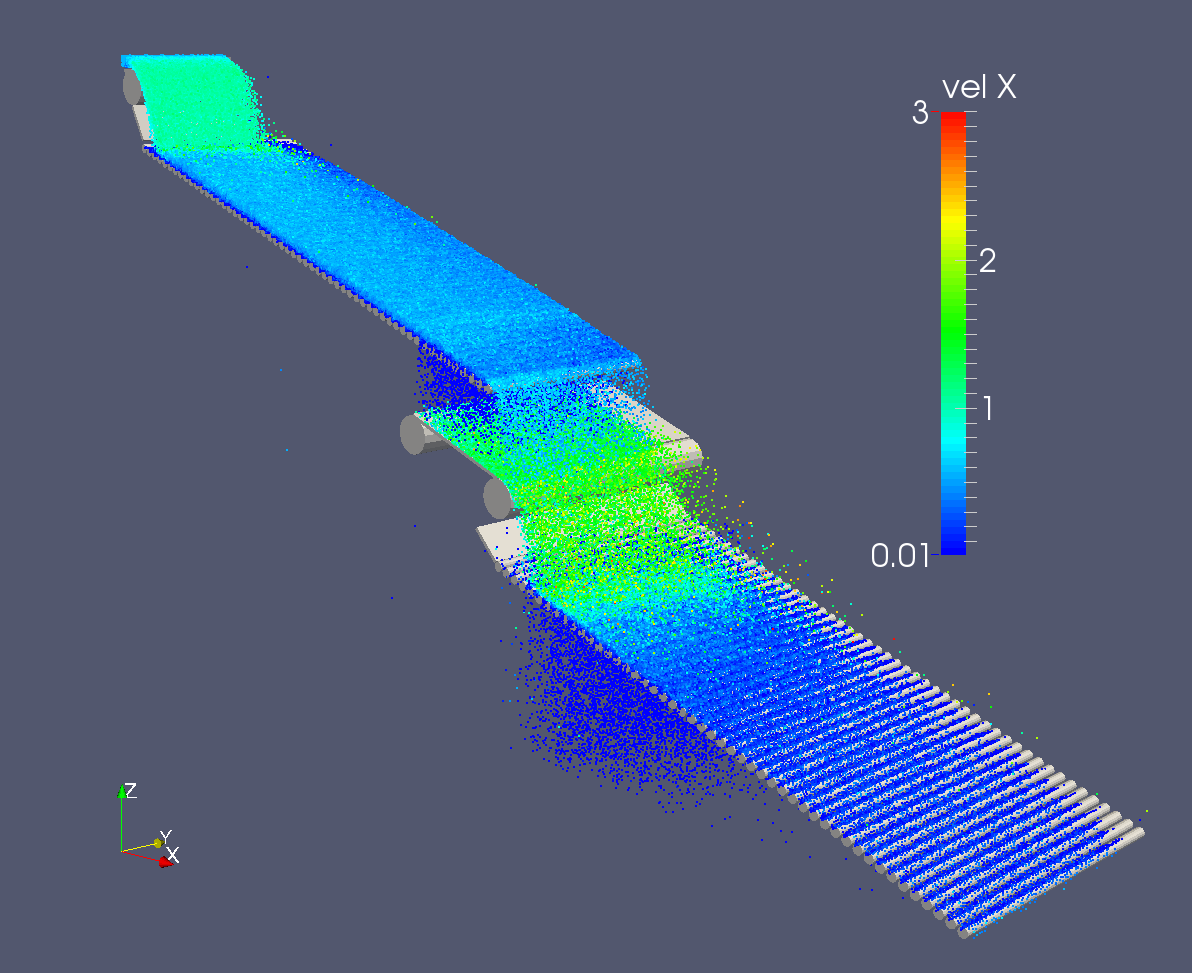
Some screens can have a more complicated geometry, e.g. this one:
Dynamics
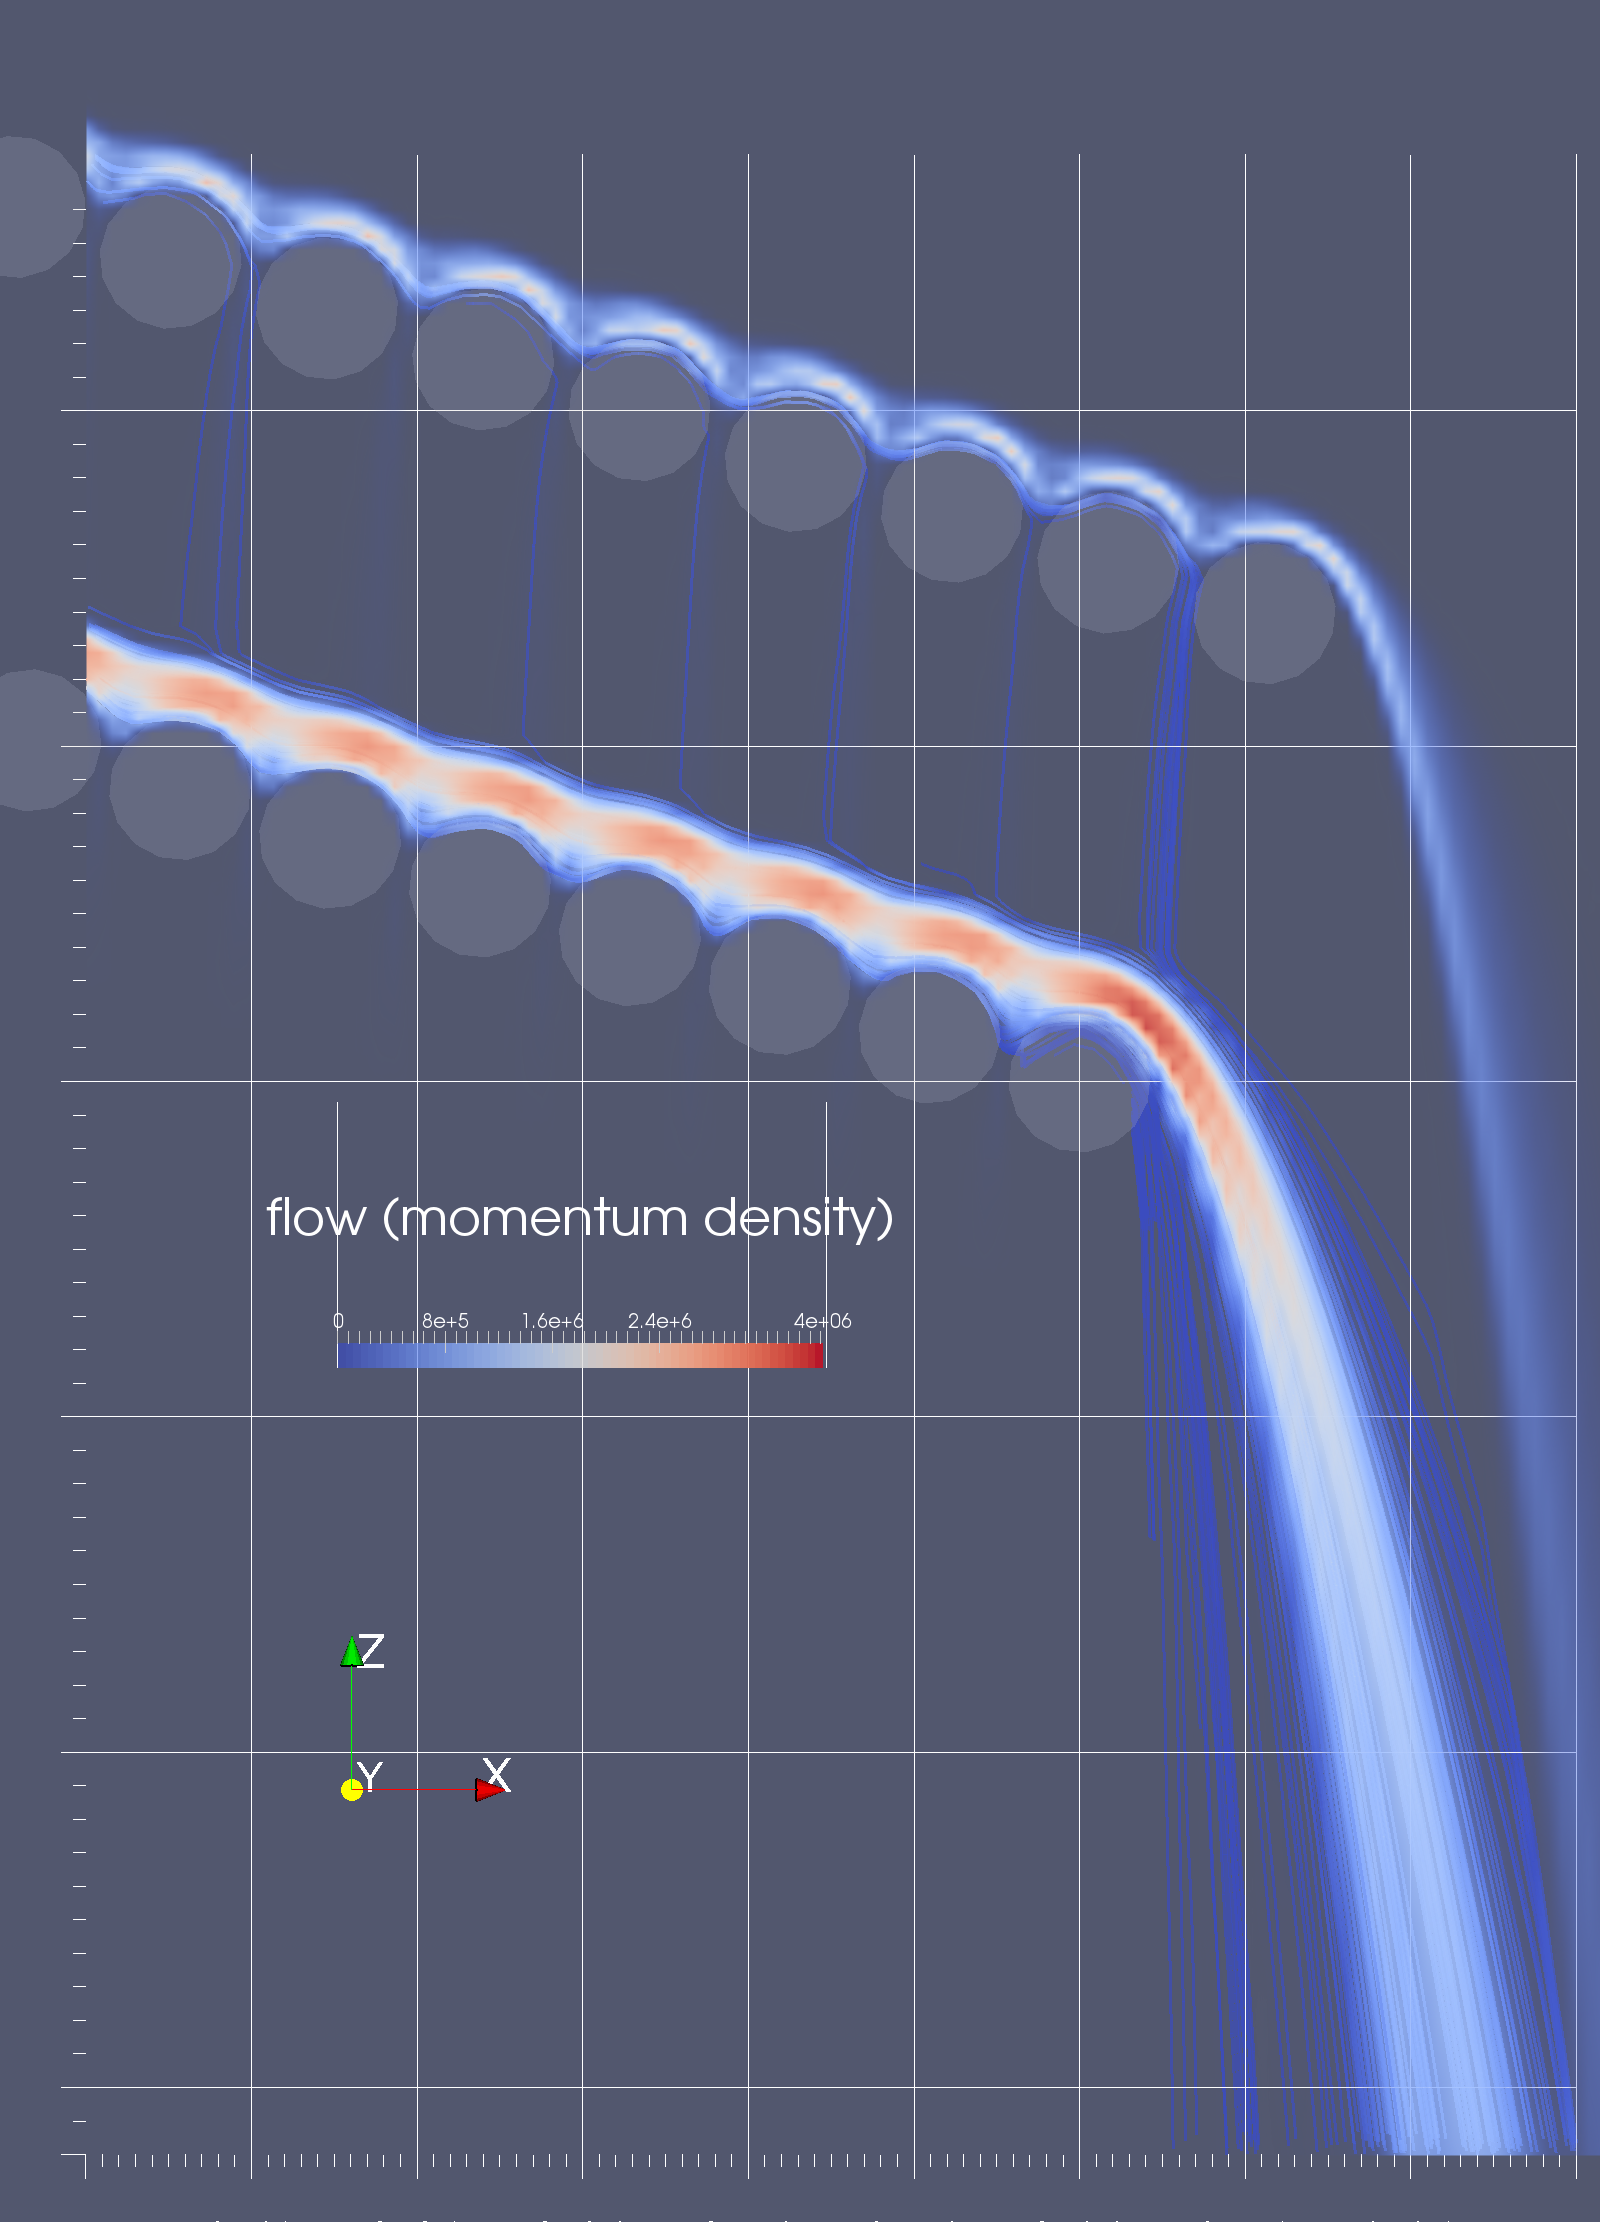
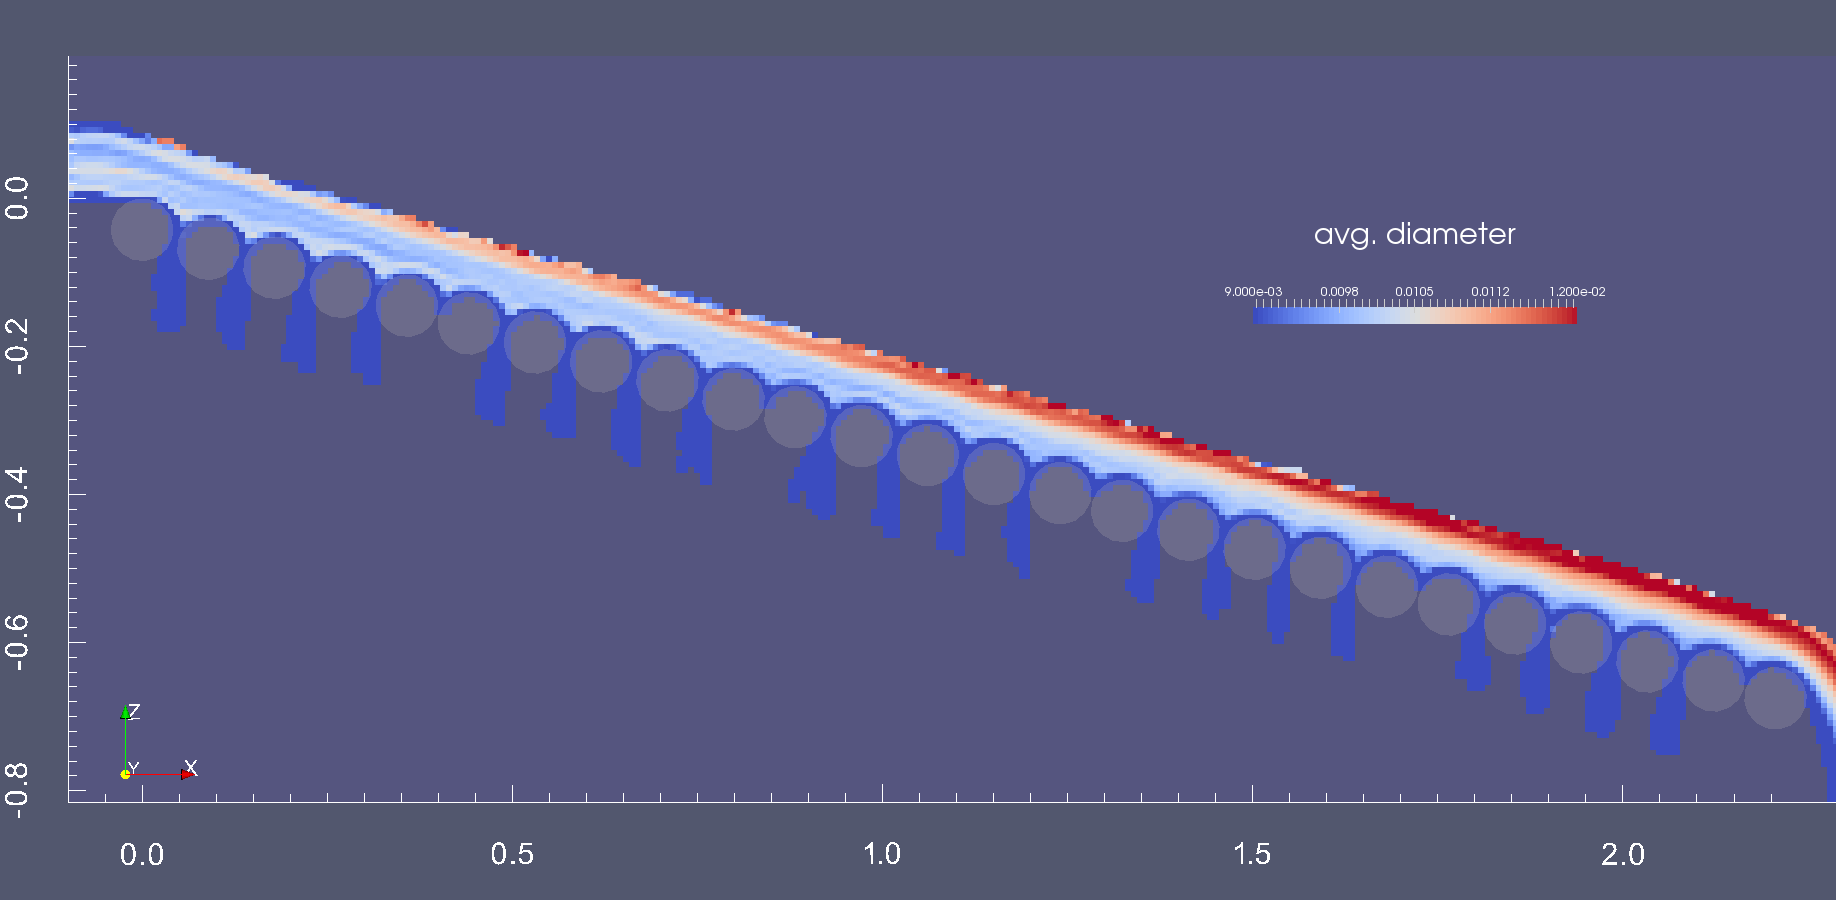
The screen is transporting pellets which undergo complex interactions between themselves and the rollers; rollers and gravity move pellets downward on the sieve.
This video shows differently sized pellets uNdresize in red, Onsize in green and oVersize in blue moving on a rather saturated screen:
The dynamics leads to some degree of separation in thick layers on the sieve:
The complexity fo the task requires some structure to describe what is happening − the contamination nomenclature.
Contamination quantification
Classifier-type screens
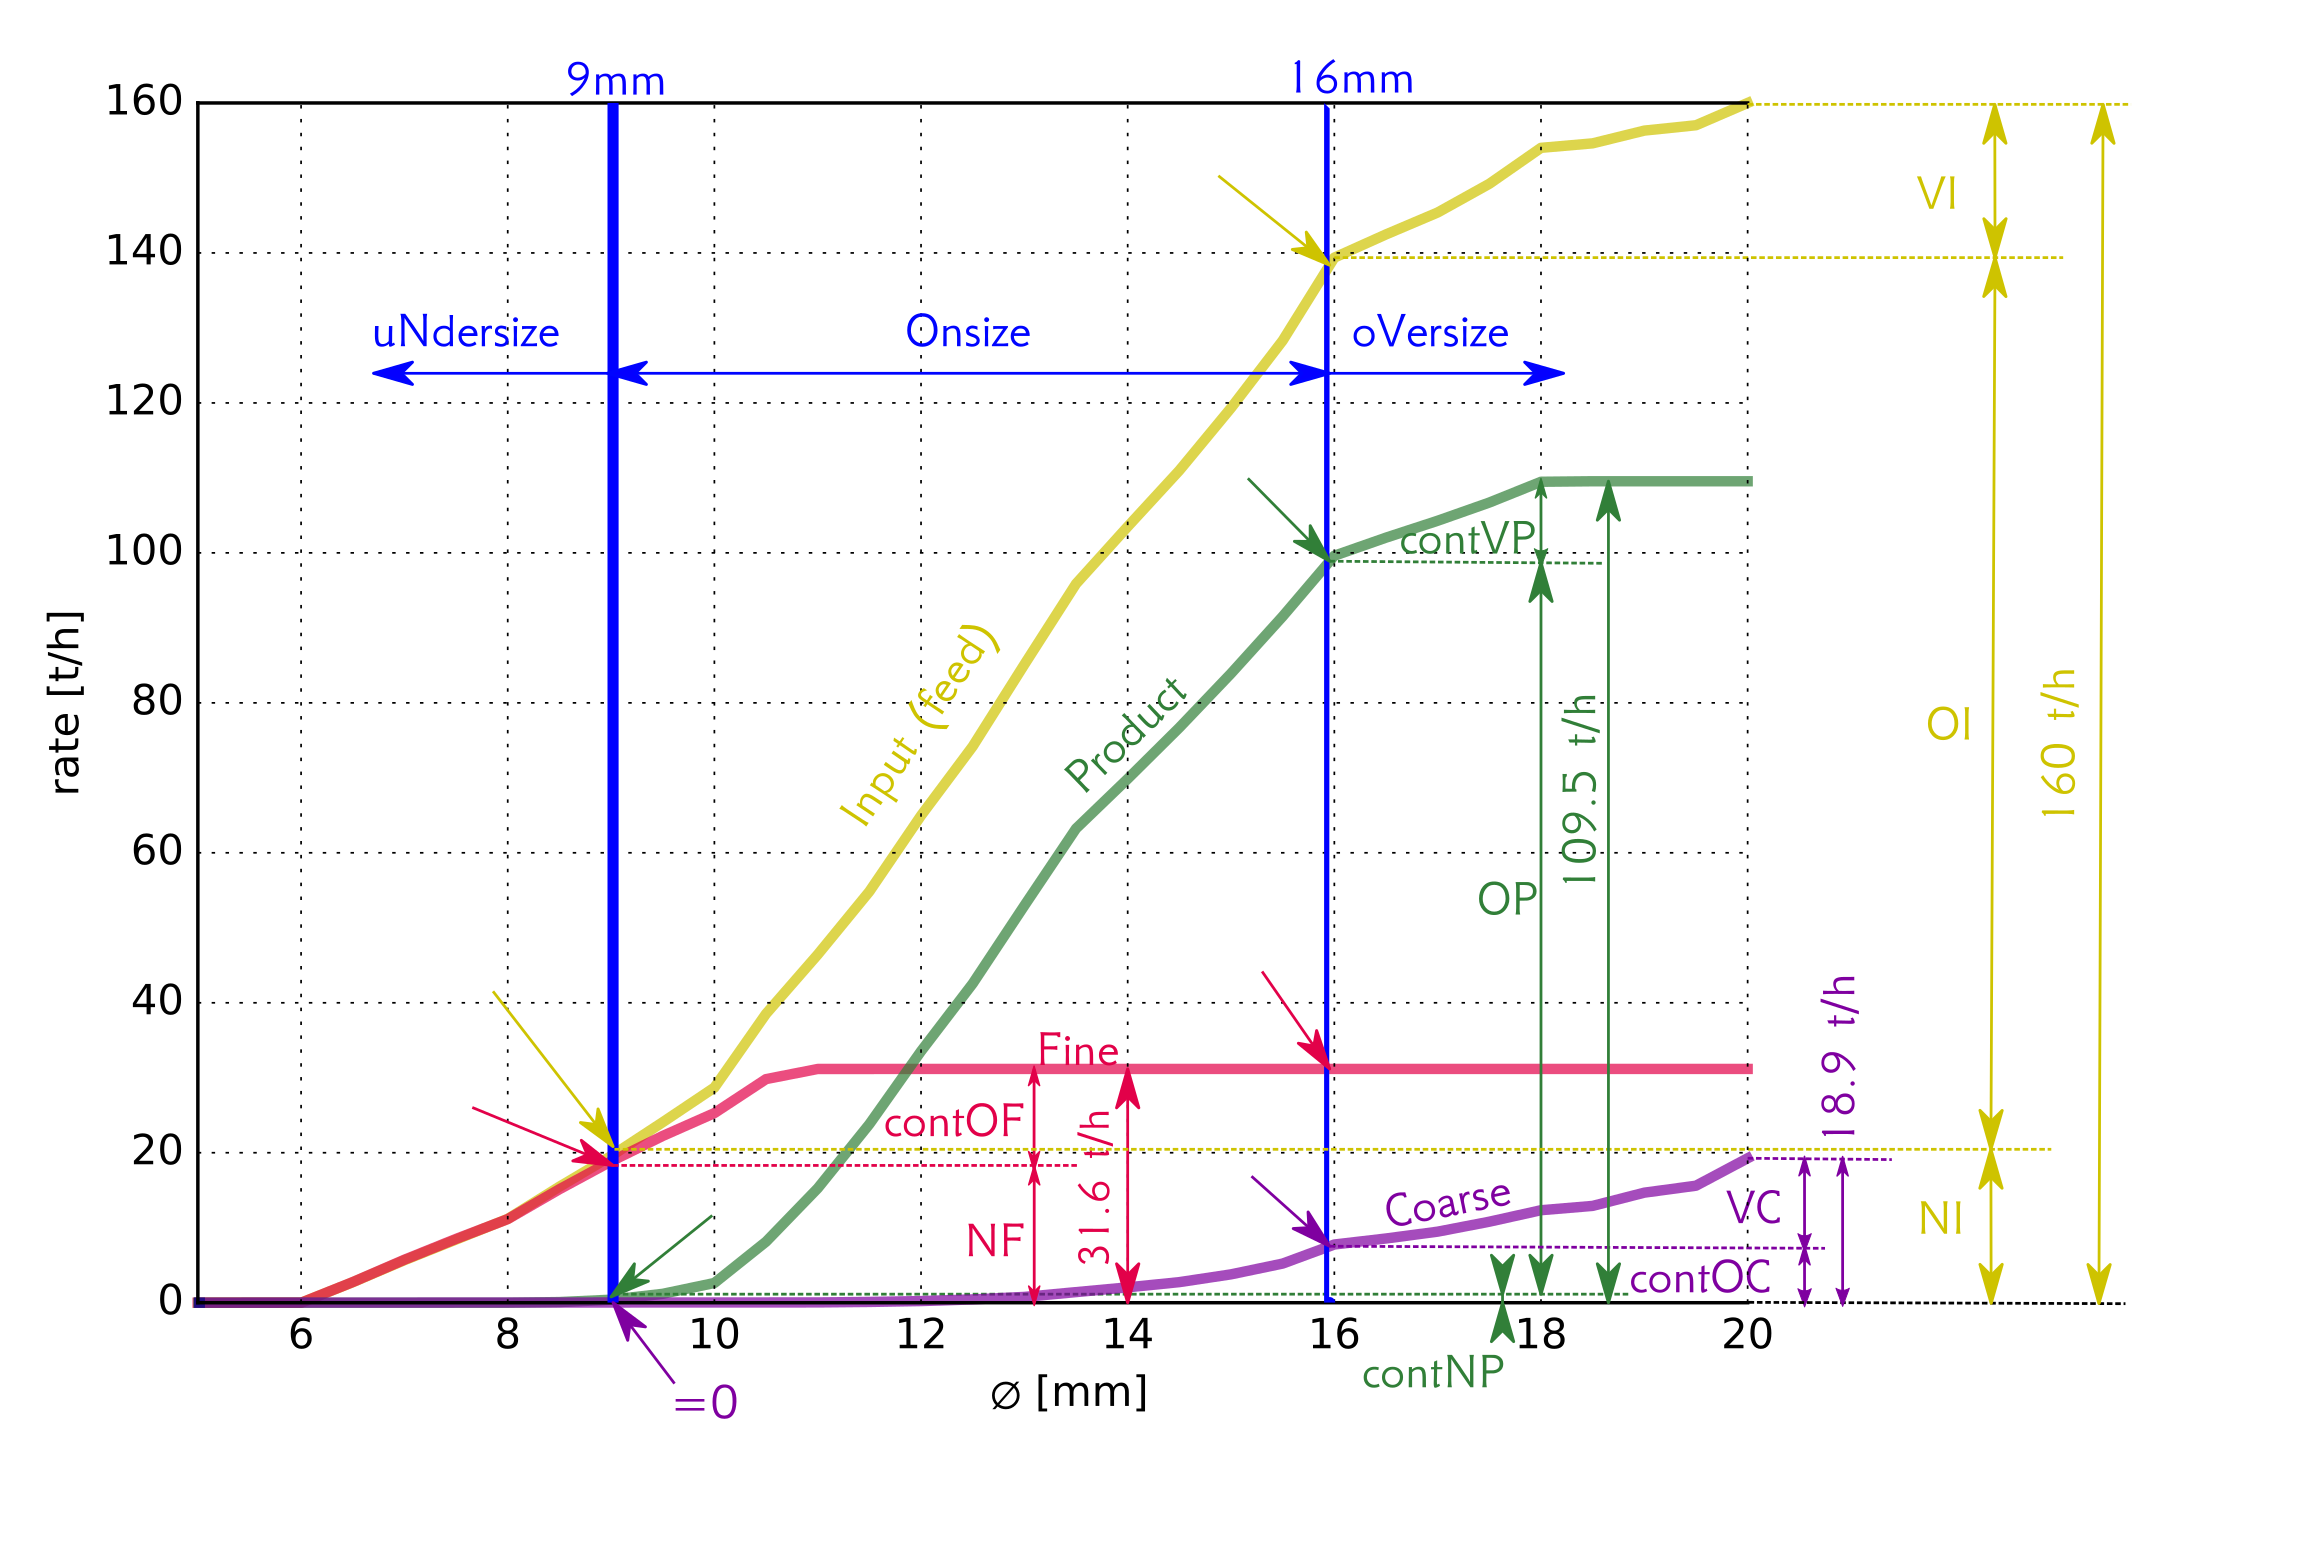
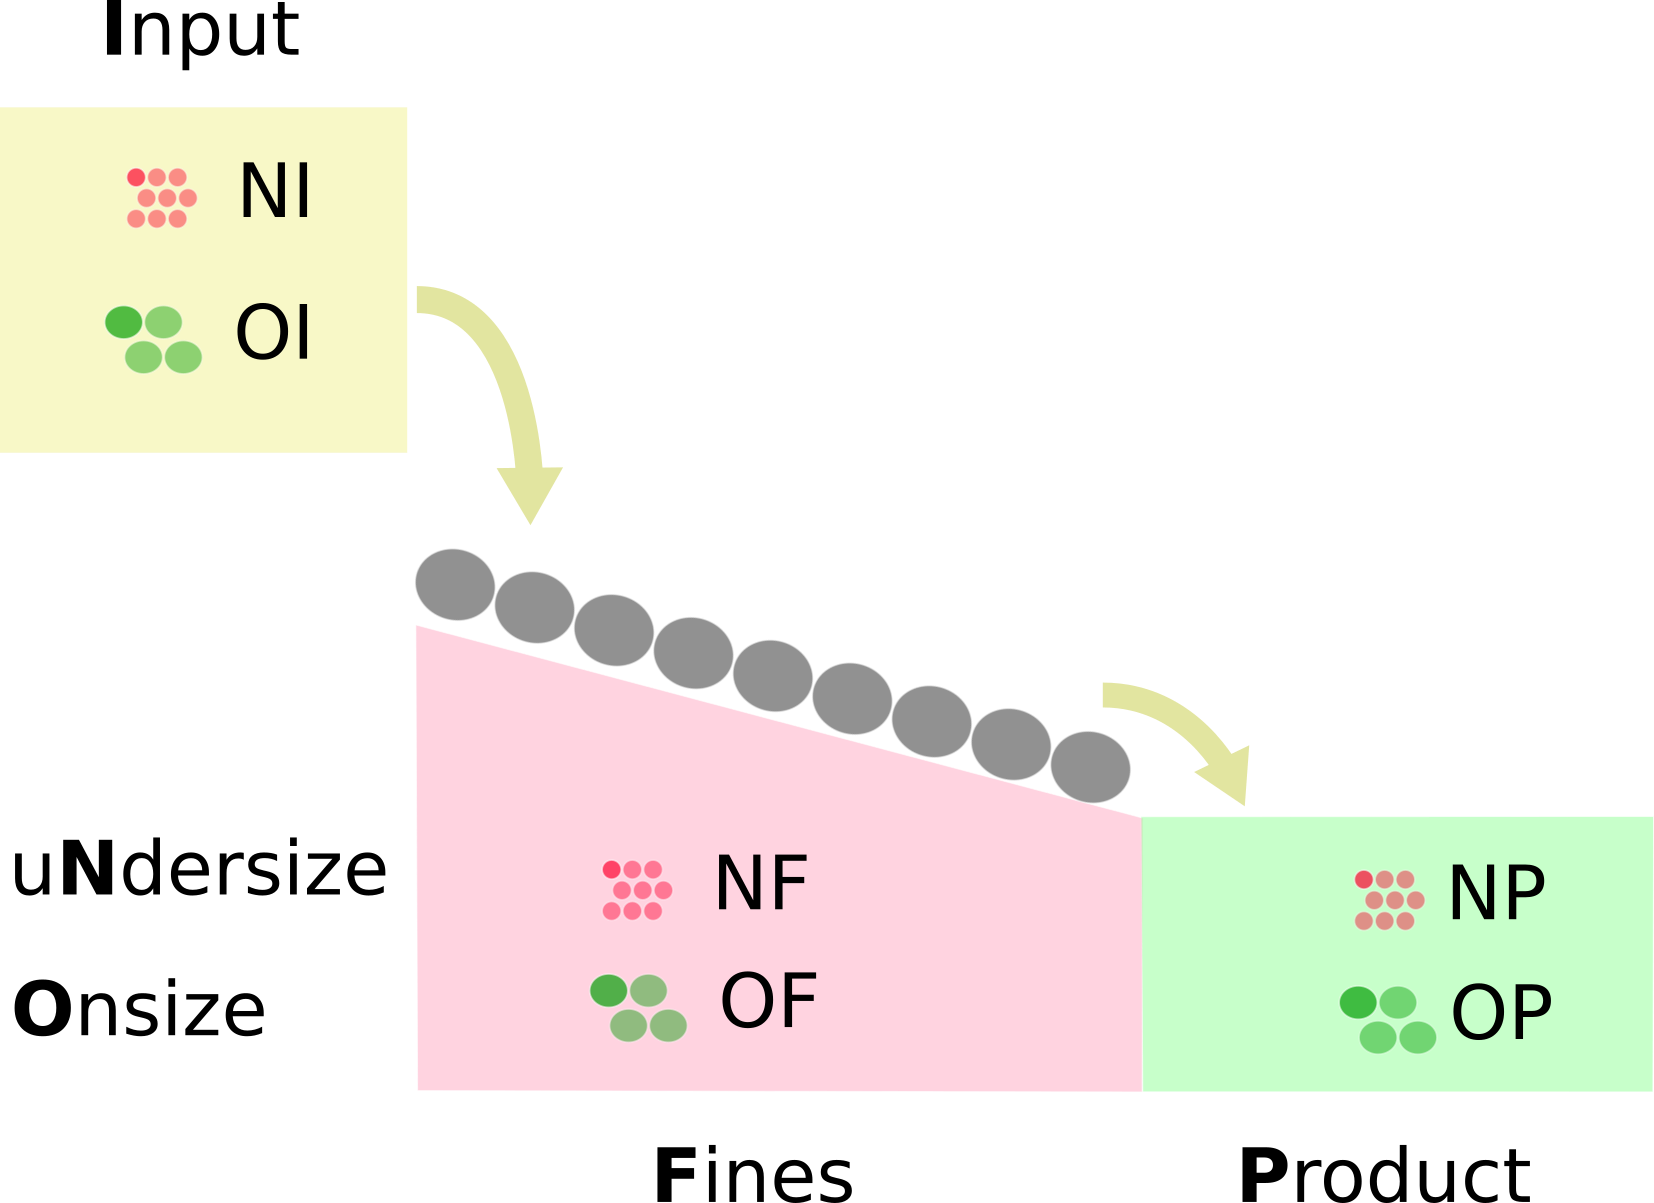
Novel terminology is used to described the sieving process in detail. Desired pellet size is defined by diameter range (usually d₀=9mm…d₁=16mm).
based on pellet diameter, we distinguish uNdersize (d<d₀), Onsize (d₀≤d≤d₁) and oVersize (d₁<d); these fractions are abbreviated as N, O, V.
based on pellet location, we distinguish Fine (the stream which ideally takes out the undersize fraction), Product (the stream which ideally takes out the onsize fraction) and Coarse (the stream which ideally takes out the oversize fraction). These streams are abbreviated as F, P, C. The feed stram is abbreviated as I (for Input).
As any pellet diameter can theoretically end up in any location, we have 9 combinations and note them with respective letter combination (NF = uNdersize in Fines, OF = Onsize in Fines, …):
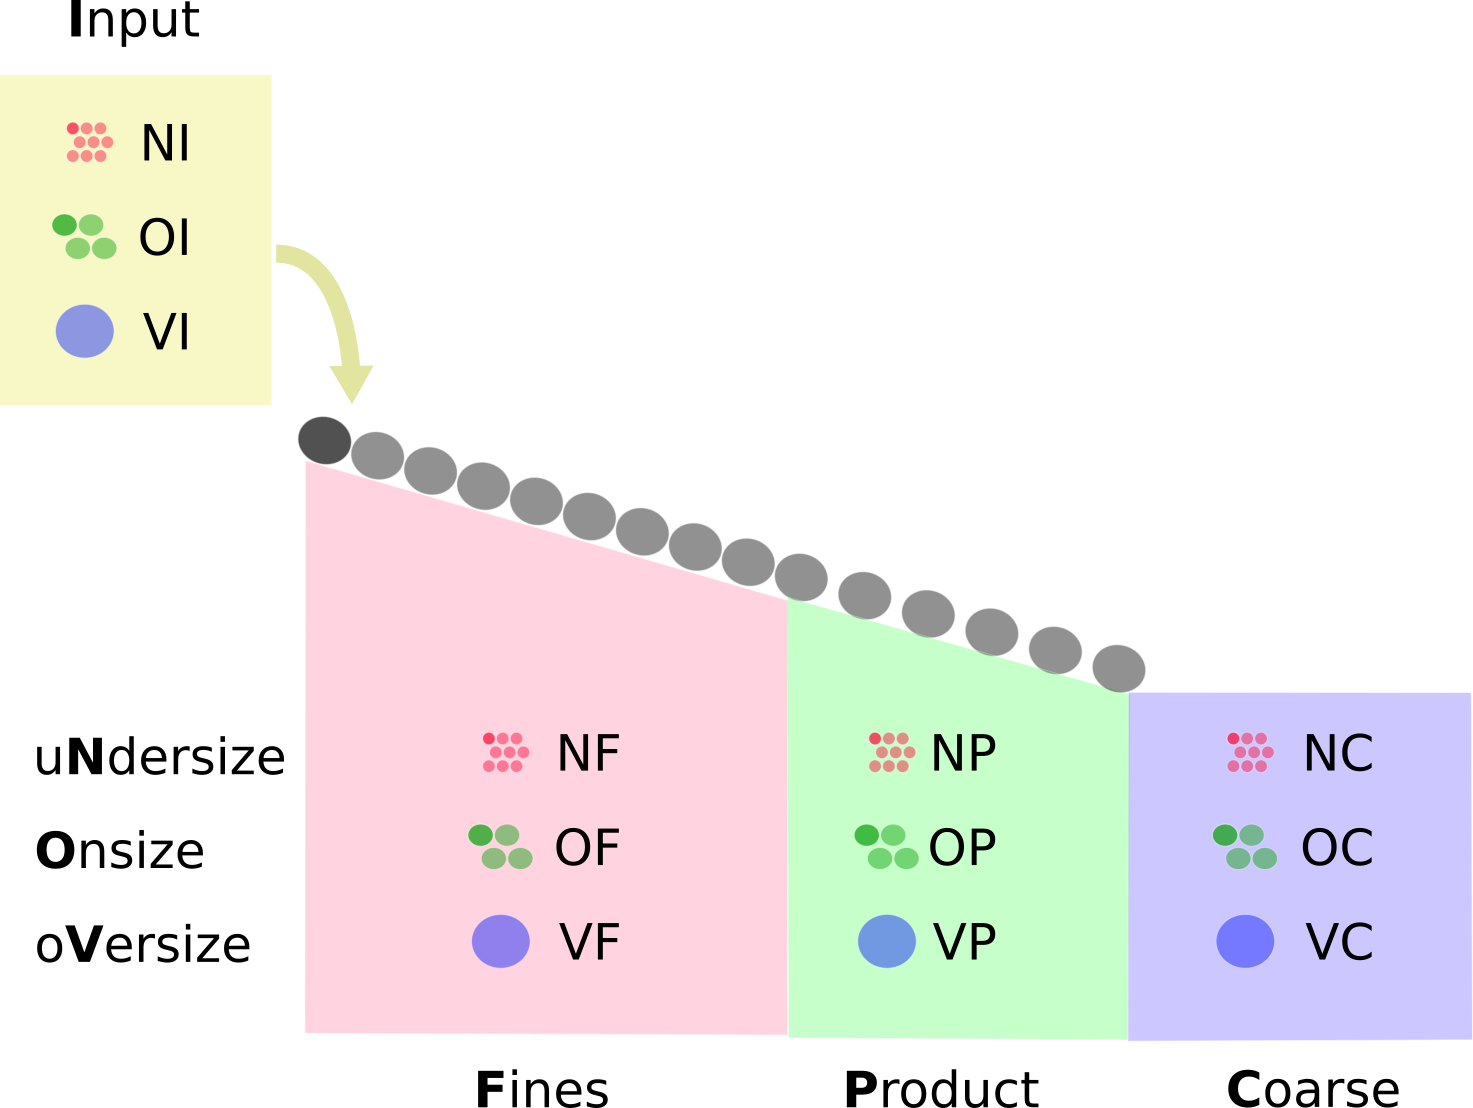
Ideal, 100% accurate screen (of classifier-type) will send pellets from the feed based on their diameter uNdresize → Fine, Onsize → Product, oVersize → Coarse, thus the diagonal entries (NF, OP, VC) will be maximized and non-diagonal entries will be zero.
Real screens do suffer from inaccuracies, thus the non-diagonal entries, called contaminations, will not be zero.
Contaminations far from the diagonal, namely VF (oVersize pellets in Fines) and NC (uNdersize pellets in Coarse) are highly unlikely to occur, save in serious misconfiguration (process parameters out of range, machine fault, simulation problem)
Only OF (Onsize in Fines), VP (oVersize in Product), NP (uNdersize in Product) and OC (Onsize in Coarse) contaminations are relevant.
VP & NP degrade quality of the product (thus we call them degrading contaminations) whereas OF & OC diminish quantity of the product (thus we call them lossy contaminations). These two groups of contaminations are balancing each other − it is easy to have high quality but abysmal quantity (e.g. by hand-picking and measuring suitable pellets); the challenge is to have acceptable quantity and acceptable quality.
OF & VP (under the diagonal) occur when pellets are screened earlier than they should, i.e. in smaller apertures. The cause is pellets being rolled flat by the rollers due to high vertical pressure from the pellet bed or when staying too long in the gap due to weak lateral transport (low inclination).
NP & OC (above the diagonal) occur when pellets are screened later than they should. This is often caused by excessive feed rate (oversaturation of the sieve, percolation), screen being too short, or lateral transport being too fast (high inclination).
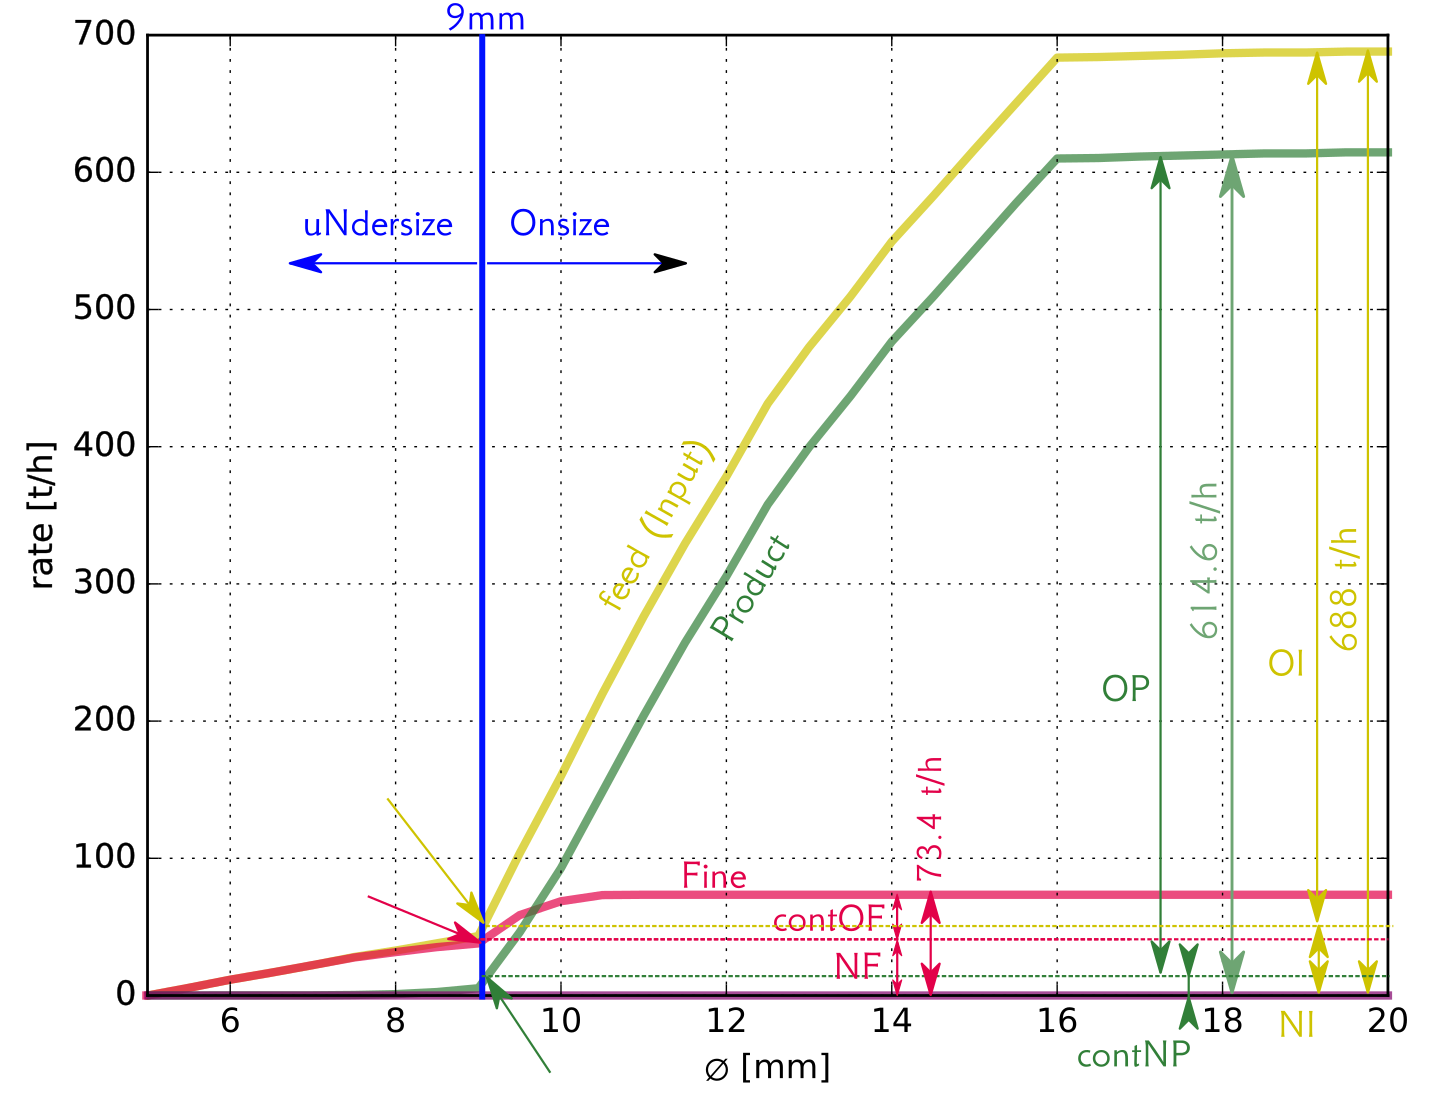
Contaminations are specific points on the PSD curves of Input, Fine, Product, Coarse:
Material flow can be shown graphically using Sankey diagrams; this type of presentation is only useful for qualitative assessment, not for quantitative comparison, where the differences are too small to be distinguishable:
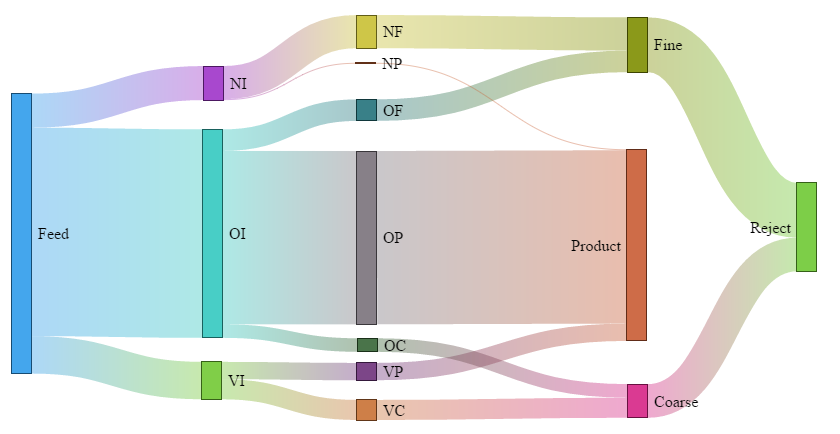
In Sankey diagram, material flow from left to right and width of each stream corresponds to the mass rate. Fine and Coarse both go into reject, which is re-processed on the pelletizing disc.
Feeder-type screens
Feeder-type screens are simpler in that they only separate Fines and Product (with pellet diameters being uNdersize and Onsize); they can be seen as a degenerated version of the classifier:
The contamination matrix is only 2×2 here, the relationship between PSD curves and contaminations is shown here:
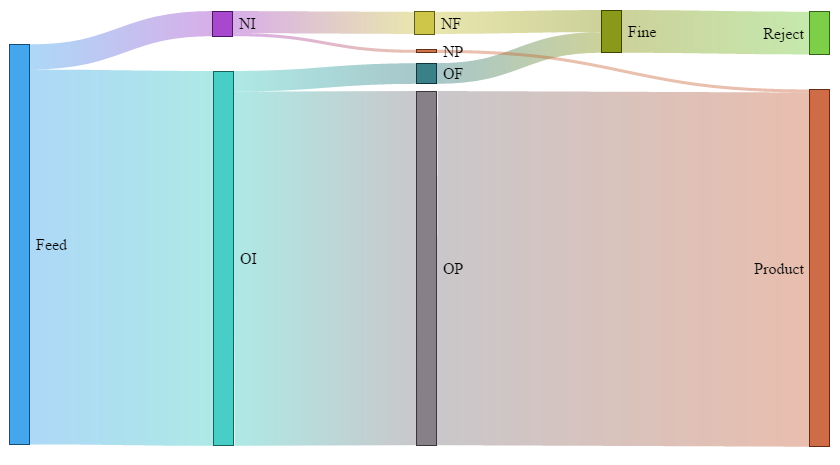
Sankey diagram for feeder-type screen; width corresponds to mass rate.
Optimizing screen parameters
The screens have many tunable parameters; they have been tuned in the practice over last 100 years, but this involves halting the production and doing physical changes of the machine. Changing a parameter in the simulation is as easy as typing a new number. These include
number of rollers: total length of screen, number of rollers for different zones (fines, product);
gap sizes in different zones of the screen;
inclination of the screen (or even using non-linear cylinder arrangement, such as broken slope);
roller angular velocity;
feed rate;
feed PSD;
…
Contamination nomenclature introduced above makes it easy to plot trends depending on the parameter being changed, or even multiple parameters. Knowing trends and understanding them is a necessary step for process optimization. Below are some examples.
Simulation results are stored in the standard HDF5 format for easy and automated processing with Python or Matlab or any other scientific package.
This is a plot of contaminations when number of gaps in the fine section changes (on the x-axis):
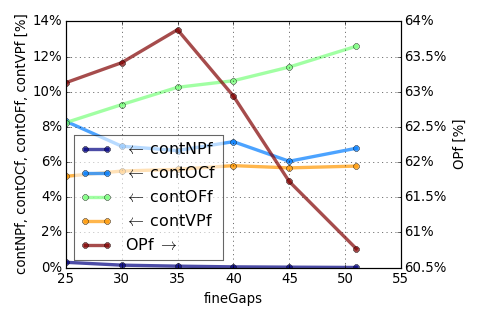
Results show significant changes in OF (decreasing with shortening screen) and OC (increasing with shortening, result of oversaturating the product section with fine material). VP is mostly unaffected. NP (which is already low anyway) decreases only slightly with increasing number of fine gaps. A rather clear maximum can be seen for OPf (onsize in product), around fineGaps=35. For fineGaps<35, fines section becomes oversaturated (light increase of NP) and, more importantly, undersize not screened out in fines makes the product section also oversaturated (significant increase of OC, and light decrease of VP).
This plot shows the PSD of feed and all sections when altering angular velocity of the rollers:
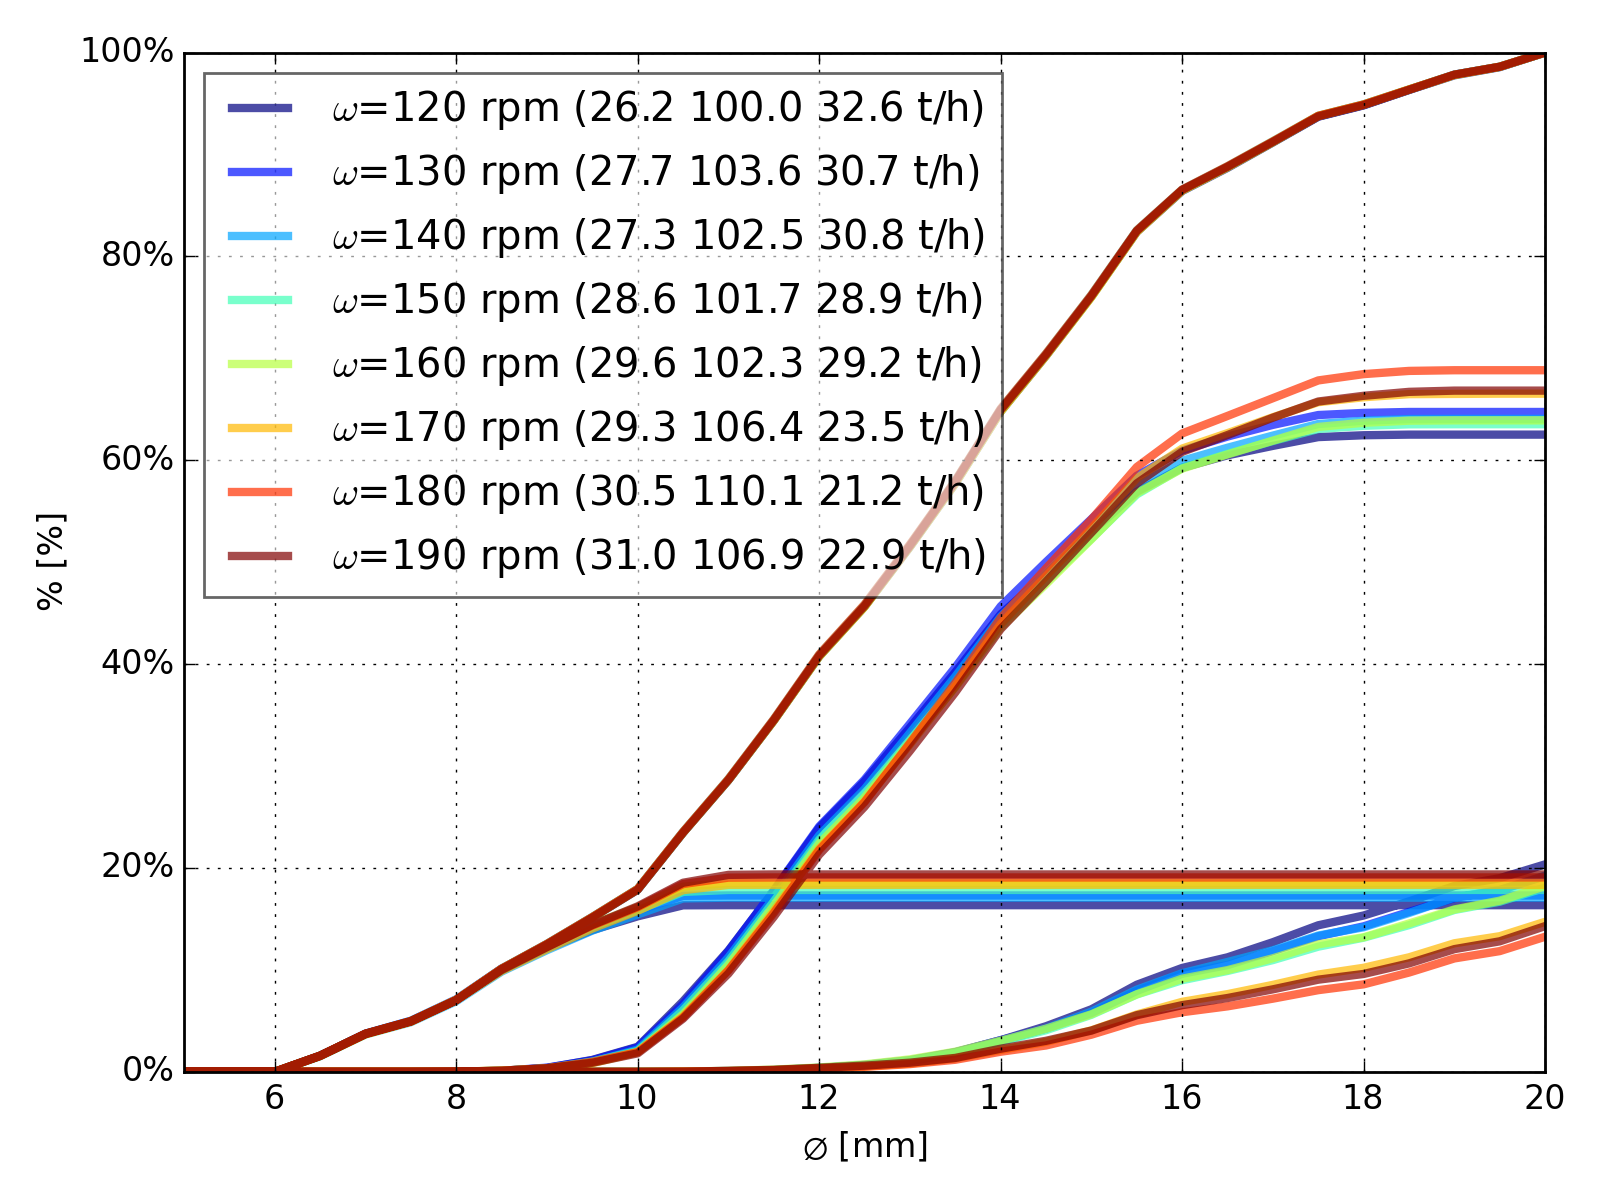
PSD curves for changing angular velocity ω: feed (same for all simulations), fine, product, coarse.
Feeder-type screen have only 2×2 contamination matrix, stacking the various atop each other (they cumulatively give 100% of the feed rate) is visually appealing and informative at once.
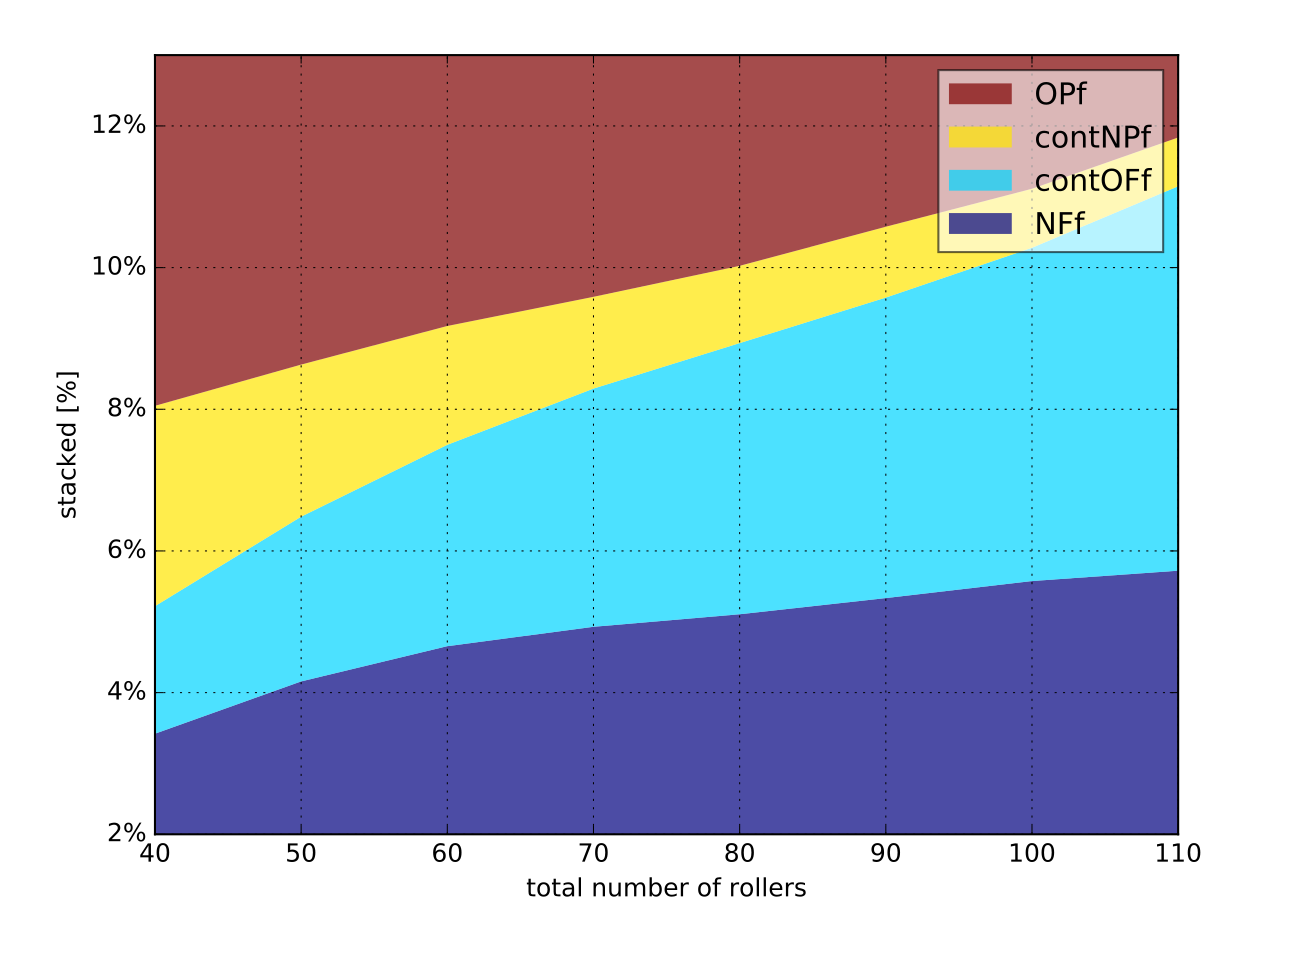
Evolution of contaminations when chaning the number of rollers in the screen (40..110 with step of 10). One can see that there is a trade-off between degrading (contNPf influencing product quality) and lossy contaminations (contOFf influencing product quantity).
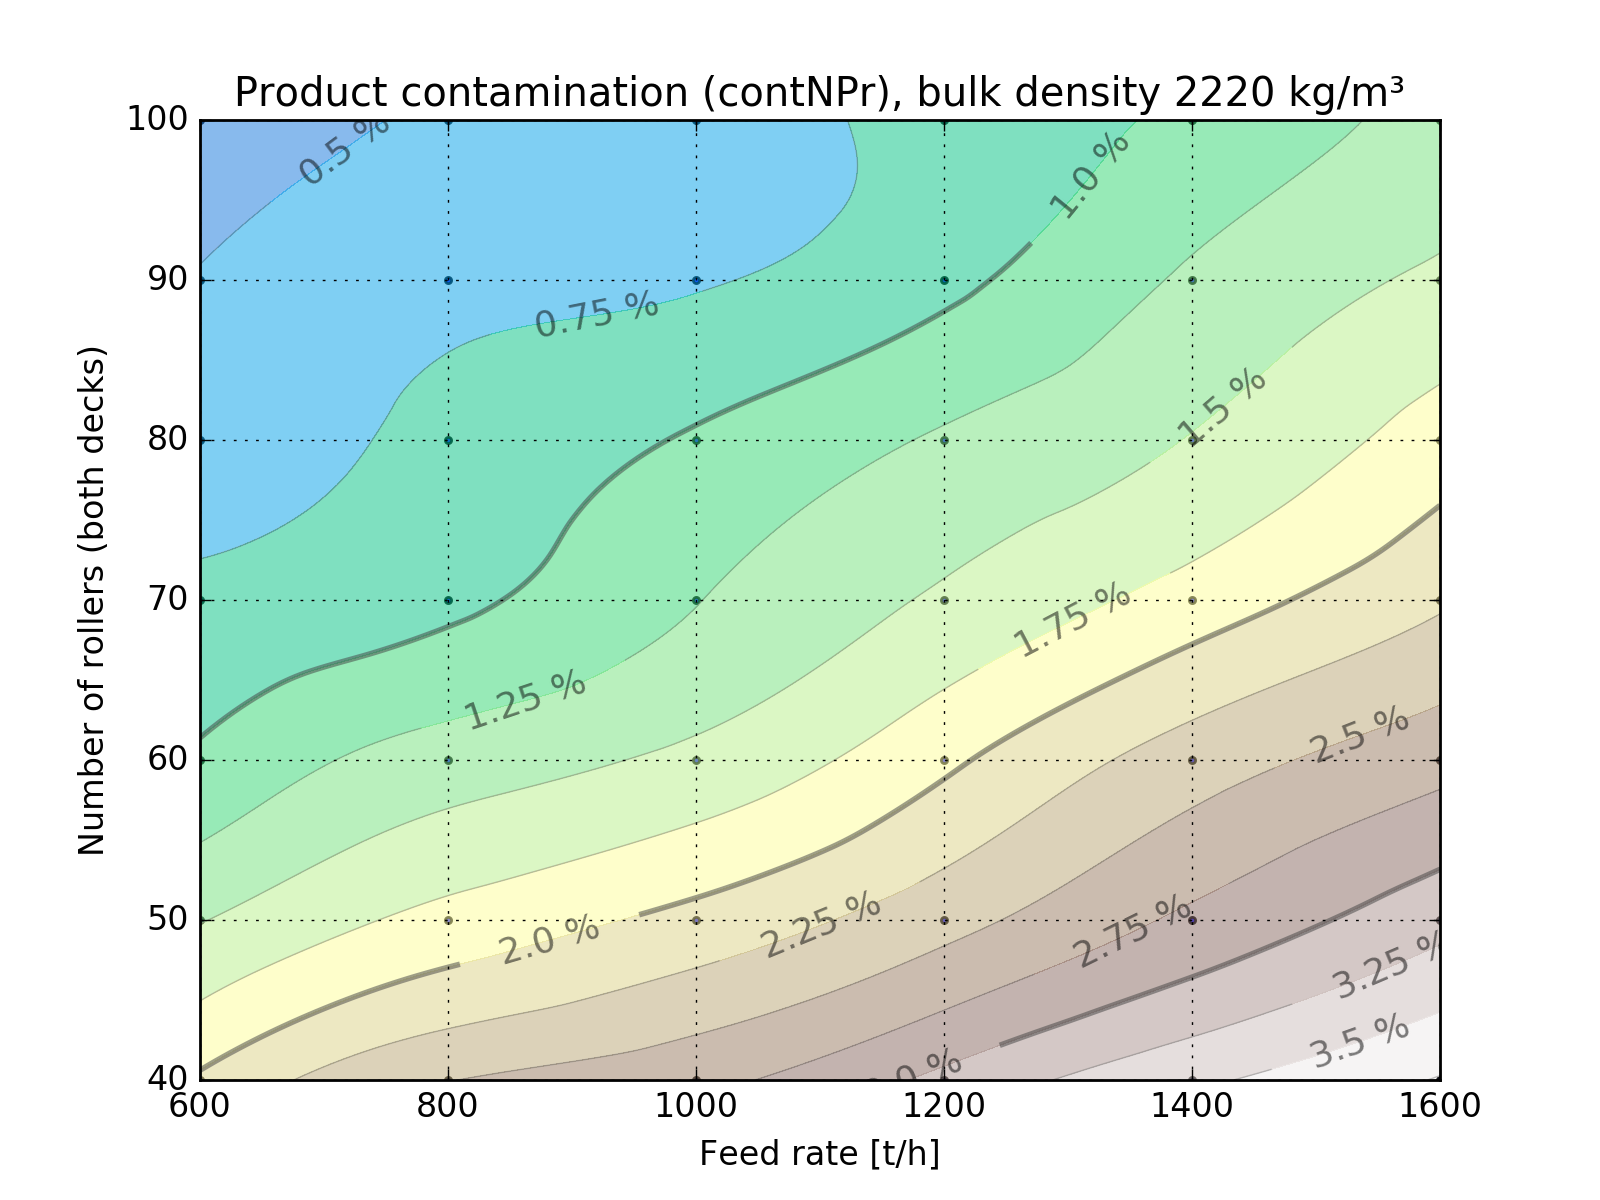
For multi-dimensional variation, visual maps can be built; in this case, number of rollers against NP contamination was plotted; each grid point represents one simulation:
Detail analysis
With WooDEM, we can not only report global flow statistics, but also analyze pellet flow down to single pellet, e.g. time pellets spend in a gap before falling through it and similar.